-
Genesis of the project
In March 2025 I started working on my free time on a small convenient tool to help a researcher friend explore 4D data he had on hand.
From here, the team got interested on developping the tool further. They invited me to korea to work with them on the next versions
-

-

-
Features
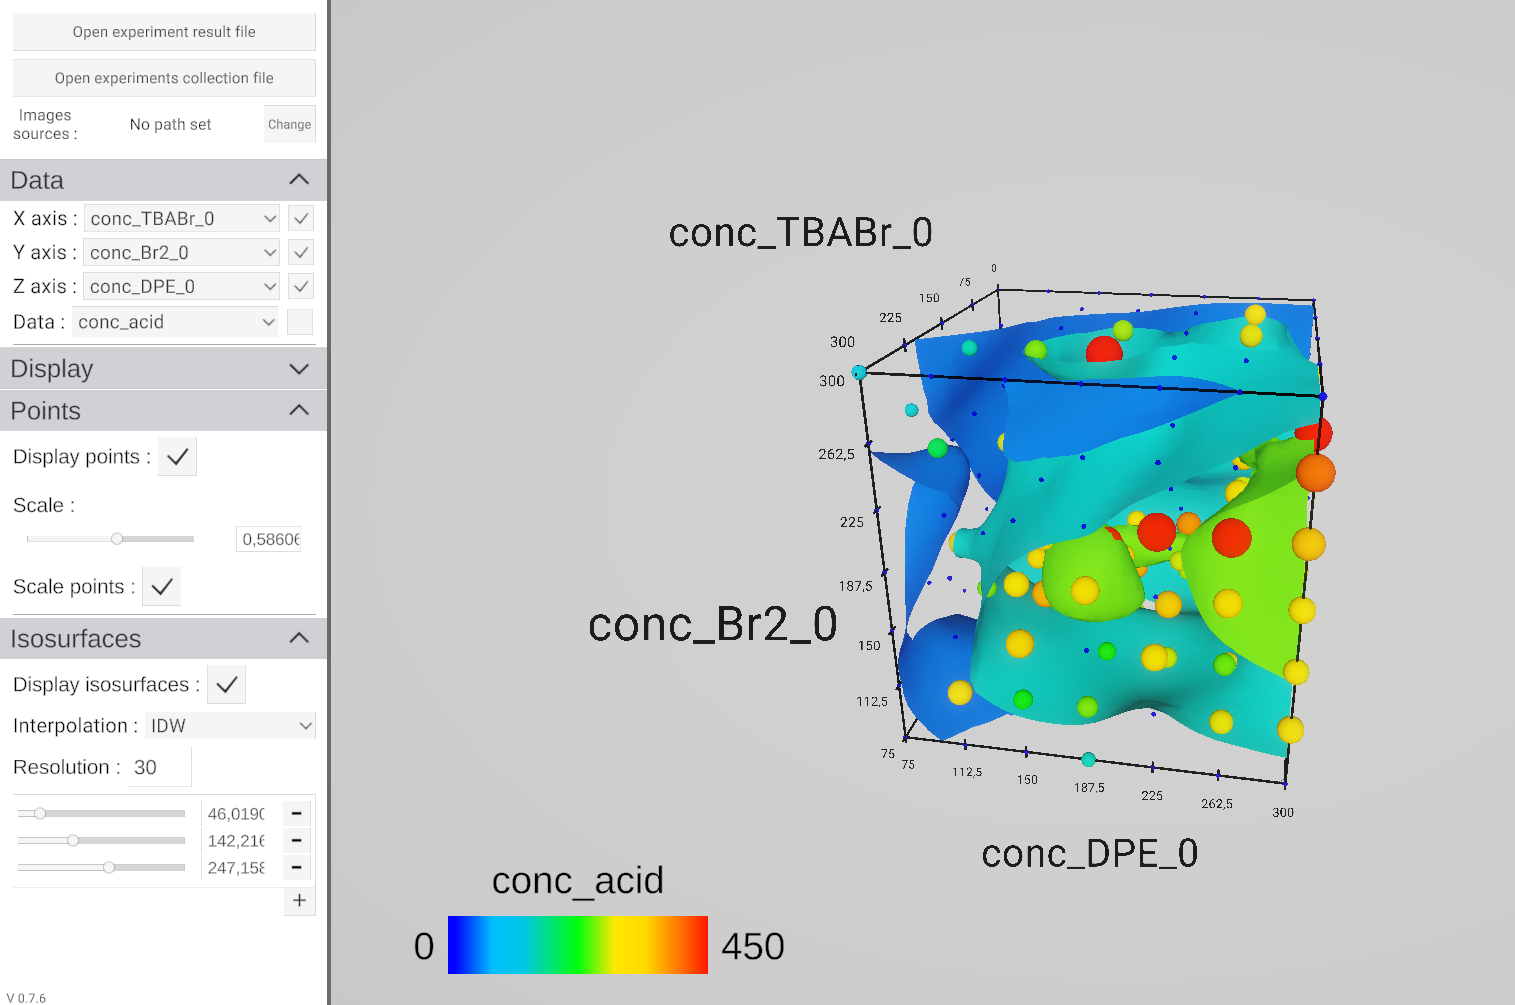
The application load the data as CSV files where lines are parsed as data entries and columns are properties
This first version display entries as points in a 3D space. 3 properties are used as the X/Y/Z coordinates while a 4th property is used as a scalar and displayed as points color and size.
-
IsoSurfaces
Isosurfaces can by displayed for any value of the scalar field. They are rendered using raymarching.
-
-
-
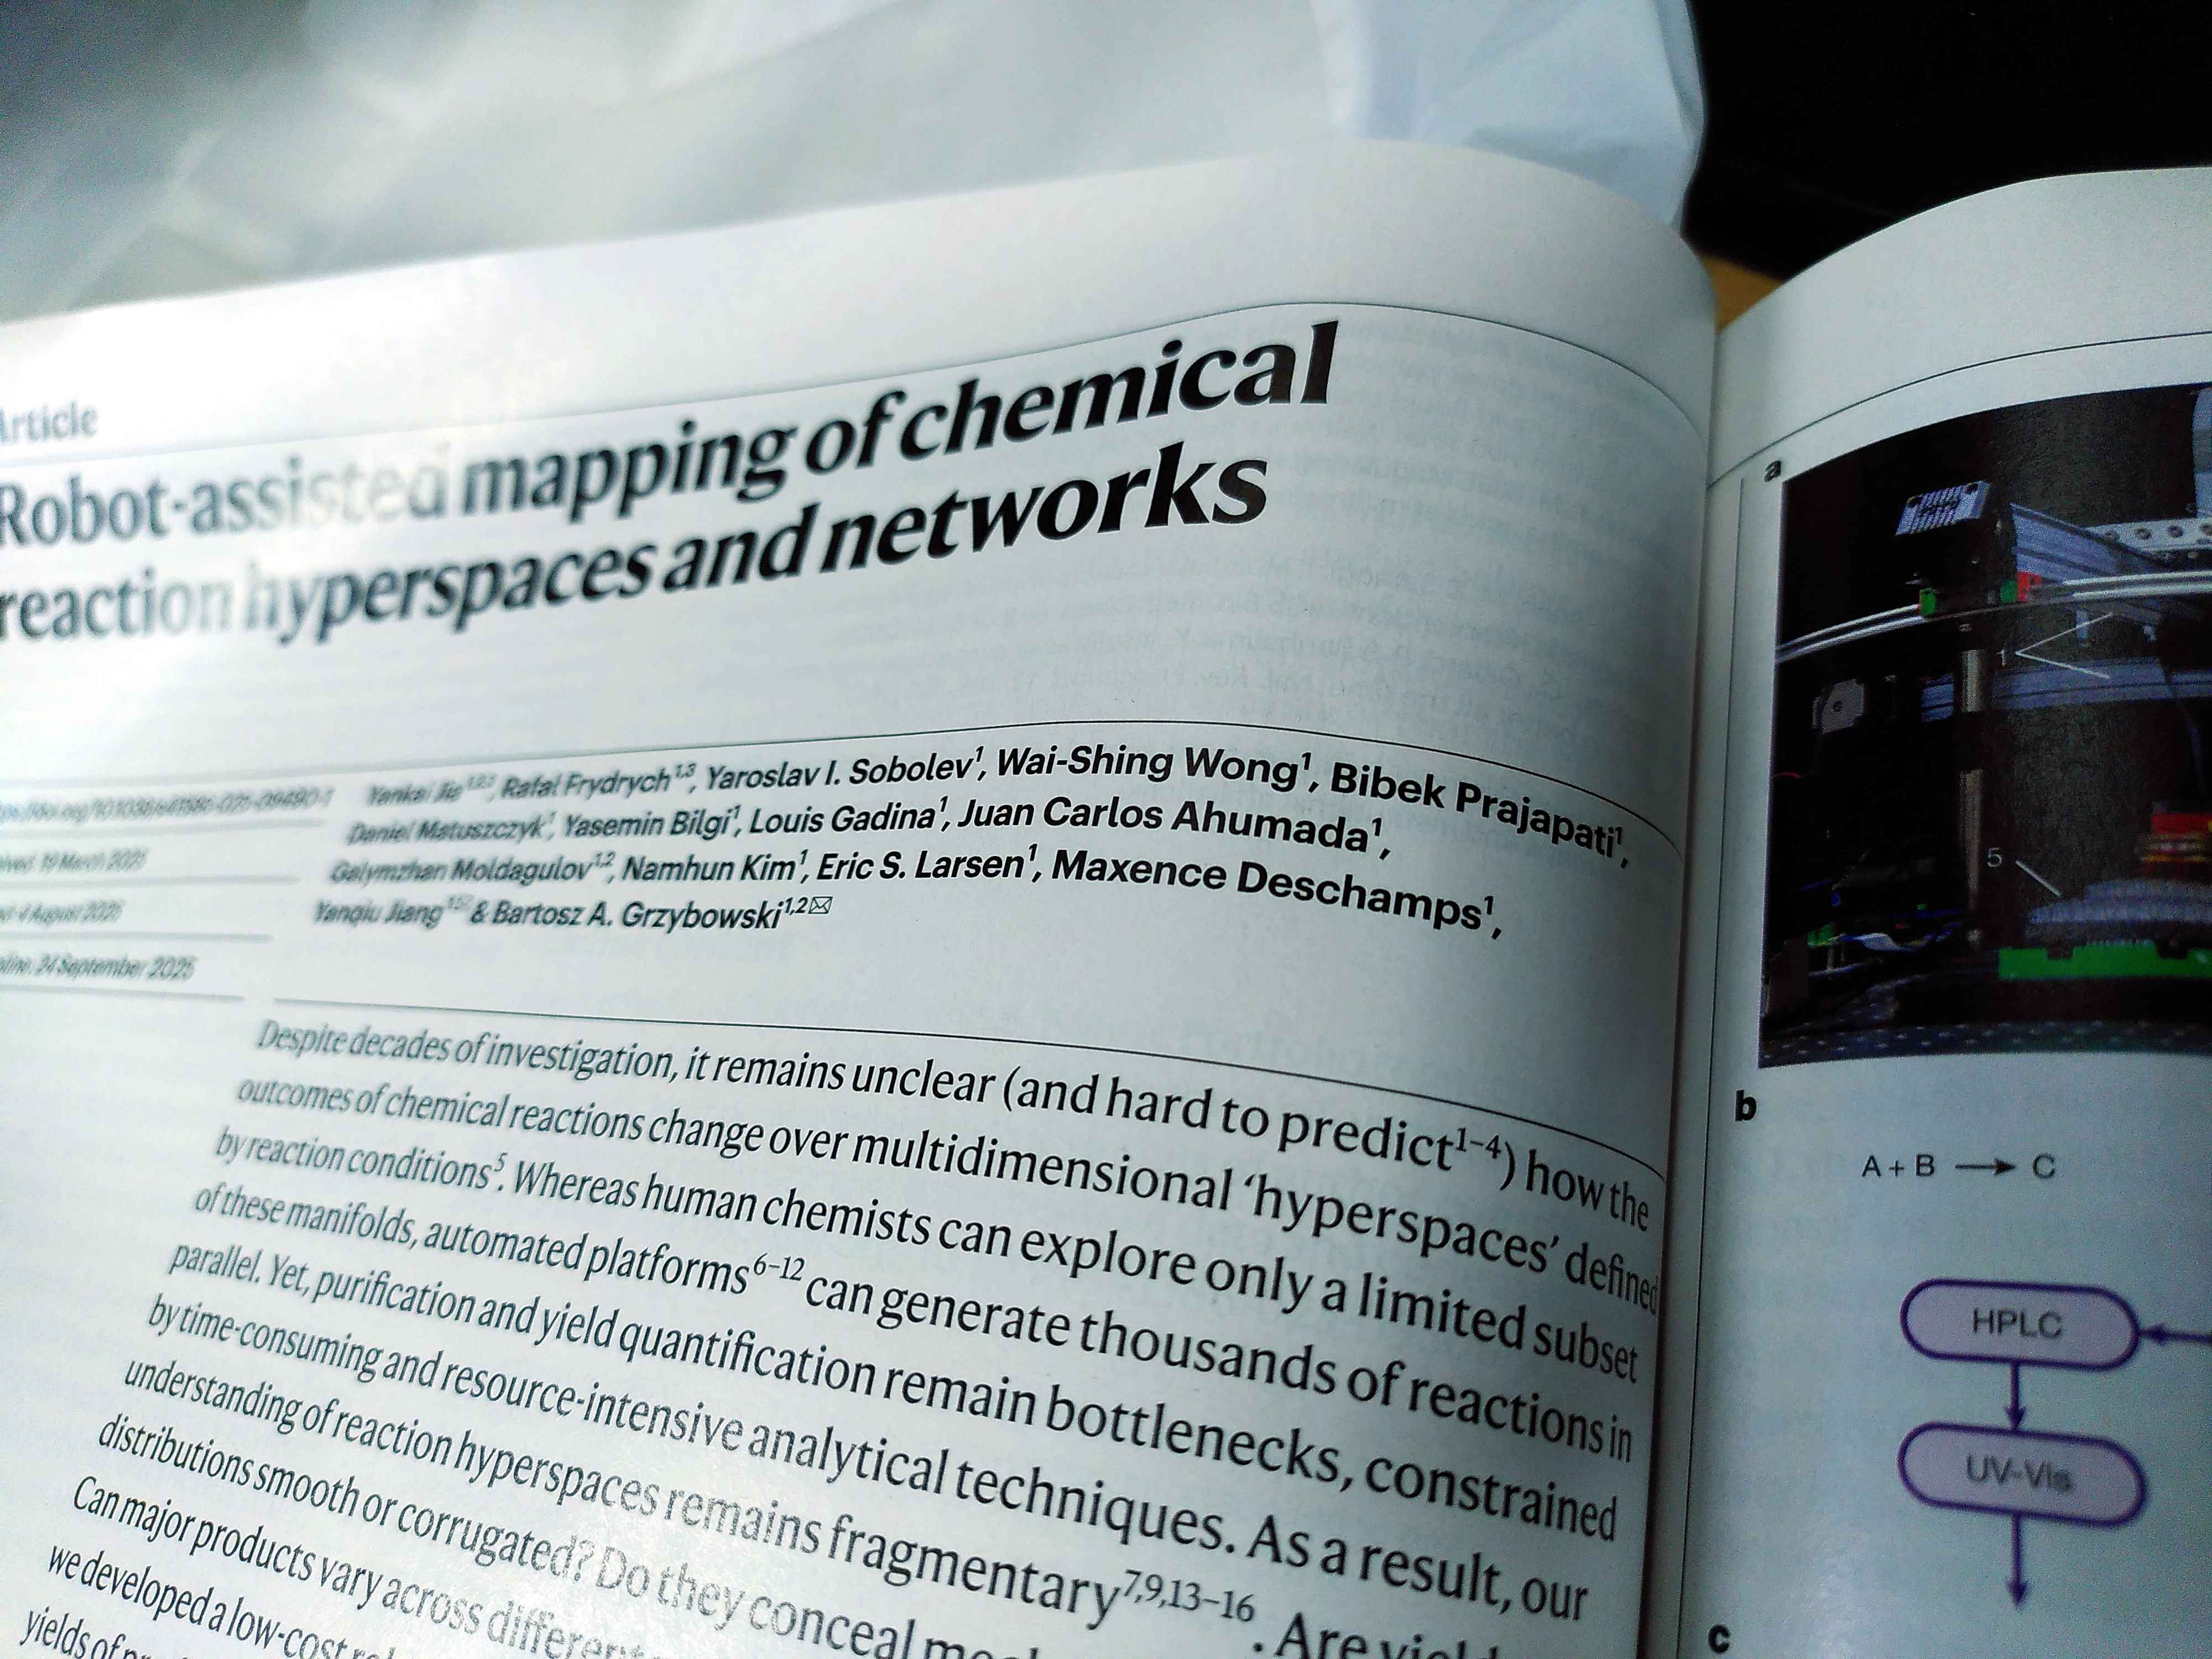
Publication
Thanks to the development of HyperSpace Viewer I was made co-author of the first scientific paper it was used in.
The paper was published in open access in Nature and can be read online (https://doi.org/10.1038/s41586-025-09490-1)